

The Pulse of the Brand in a Shifting Market
In Egypt’s fast-moving consumer goods (FMCG) market, financial spreadsheets only tell you what happened yesterday. They show you last month’s revenue or last quarter’s volume drop, but they rarely tell you why those numbers shifted. By the time a drop in sales velocity registers on a balance sheet, thousands of consumers have already quietly switched their loyalty to a competitor.
Before establishing a continuous tracking routine, brand managers must establish a baseline. Integrating your tracker alongside a foundational market assessment for Egyptian FMCG strategy ensures you are benchmarking against the true total addressable market.
A brand’s reputation and mental availability are its ultimate defensible moats. In a volatile macroeconomic landscape where inflation and currency adjustments force Egyptian households to constantly re-evaluate their monthly budgets, relying on annual market surveys or gut feeling is a major strategic risk. Top-performing brand managers do not wait for quarterly sales declines to diagnose a problem, they use Brand Health Tracking (BHT).
What is a Brand Health Tracker (BHT)?
A Brand Health Tracker is a continuous or periodic quantitative measurement system that evaluates how consumers perceive, feel about, and interact with a brand over time. By monitoring core metrics, such as mental availability, brand associations, customer satisfaction, and purchase intent, against direct competitors, a BHT acts as an early-warning radar system for market share changes.
The Core Metrics: What Egyptian FMCG Brands Are Actually Tracking
When evaluating brand performance in Egypt’s dynamic FMCG sector, tracking isolated data points is no longer enough. High-performing marketers rely on a structured hierarchy of metrics, anchored by a composite index that measures true market strength.
The Headline Metric: Brand Power Index (BPI)
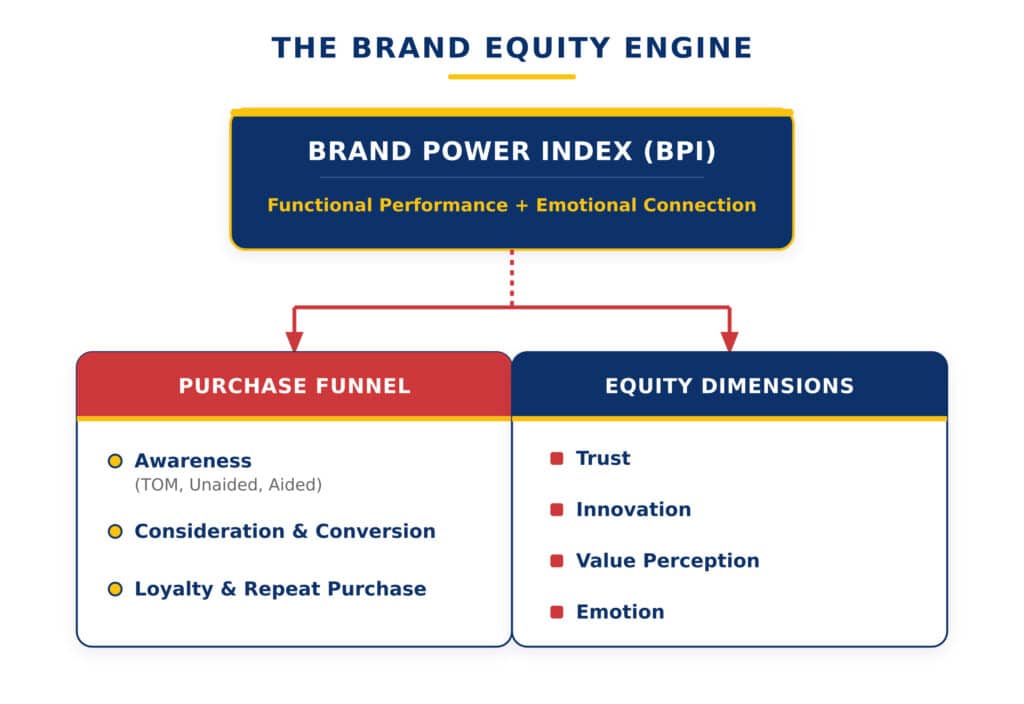
At the center of modern brand health tracking is the Brand Power Index (BPI). Rather than looking at awareness or sales in a vacuum, BPI integrates a brand’s functional performance with its emotional connection to consumers relative to the competition.
BPI correlates strongly with real-world sales growth and market share, offering a single, definitive score of how strongly a brand dominates its competitive space and where gaps exist against key rivals.
Tracking brand health indicators only creates value when tied directly to commercial strategy. Transforming raw tracking feeds into actionable growth levers requires modern FMCG data analytics and decision engines that link perception metrics directly to sales velocity.”
The 4 Core Equity Dimensions
To understand why a brand holds a specific BPI score, tracking engines evaluate consumer perceptions across four essential equity dimensions:
- Trust: Measures brand reliability, consistent product quality, and consumer confidence, critical for retention when buyers are hesitant to risk money on unknown alternatives.
- Innovation: Evaluates how well the brand adapts to changing market needs, introduces relevant new formats or flavors, and stays modern in the eyes of the target audience.
- Value Perception: Monitors price-to-worth alignment. A healthy brand builds strong enough equity that consumers perceive high worth beyond mere unit cost, allowing the brand to maintain competitiveness without endlessly discounting.
- Emotion: Captures the psychological bond and affinity consumers feel toward the brand, driving brand preference and a willingness to choose it over cheaper substitutes.
Mapping these dimensions against competitors creates clear perception maps, revealing strategic white spaces and highlighting attributes to Maintain, Grow, or Ignore.
The Integrated Purchase Funnel & Associations
Layered beneath BPI and equity dimensions is the real-time tracking of the consumer journey and mental associations:
- The Awareness Hierarchy: Tracking moves from Top-of-Mind (TOM) awareness (the first brand named in a category) to Unaided (Spontaneous) recall and Aided recognition. High aided awareness with falling TOM awareness is a classic warning sign that a brand is losing mental availability.
- Funnel Conversion Efficiency: Measuring the drop-off rates from Awareness à Consideration à Conversion à Loyalty. This pinpoints whether sales friction is caused by weak advertising reach, poor physical availability on retail shelves, or low repeat purchase intent.
- Category Entry Points (CEPs) & Associations: Tracking the mental cues that link a brand to specific purchase triggers (e.g., “good for quick family breakfasts,” “affordable daily treat,” or “authentic Egyptian taste”). Strong mental associations increase both organic choice at the shelf and consumer willingness to pay.
The Core Brand Drivers: Product & Price Optimization
While tracking general brand health provides high-level visibility, diagnosing growth opportunities requires drilling down into the two primary tactical levers driving consumer choice at shelf: Product and Price.
In Egypt’s FMCG landscape, consumer decisions are heavily shaped by structural economic shifts and rising local competition. Evaluating how well your brand performs across these two drivers helps determine whether you are delivering the exact value consumers demand or inadvertently driving them into the arms of competitors.
The Product Driver: Relevance, Quality & Local Equity
The Product driver measures how effectively your physical offering meets consumer expectations on the shelf. In Egypt, taste, texture, formulation, and local trust act as the ultimate foundation for repeat purchases:
- Sensory & Functional Non-Negotiables: Packaging gets a consumer to pick a product up for the first time, but the product experience determines whether they return. Tracking product satisfaction across key sensory attributes (e.g., taste profile, formulation consistency, or aroma) pinpoints exact performance gaps relative to category benchmarks.
- The “100% Egyptian Sourcing” Advantage: Capitalizing on local manufacturing, authentic Egyptian taste profiles (such as regional spice blends or traditional dairy notes), and domestic supply chain reliability has transformed from a subtle brand story into a major product driver. Local sourcing reassures consumers of consistent availability while building strong emotional equity.
- Format & Assortment Relevance: Tracking product drivers reveals whether your current pack sizes align with usage habits. In times of budget tightening, single-serve impulse formats or multi-use family packs often outperform standard mid-tier offerings.
The Price Driver: Value Perception & Price-Pack Architecture
The Price driver does not simply track who is cheapest; it evaluates Price-Value Alignment, whether consumers perceive that your product’s quality justifies its price tag.
- Price-per-Gram Equity: Egyptian household managers calculate value mathematically. If a price increase or size reduction (shrinkflation) disrupts the perceived price-per-gram or price-per-milliliter threshold, purchase intent collapses rapidly.
- Willingness to Pay & Premiumization: A healthy brand maintains strong value perception even when pricing sits above category averages. BHT price metrics measure how much of a price premium your brand equity can sustain before volume drops off.
- Price-Pack Architecture (PPA): Tracking pricing drivers allows FMCG brands to optimize their tiering, ensuring affordable entry-level price points for budget-conscious shoppers alongside high-margin, value-added SKUs for premium segments.
By constantly auditing Product performance and Price perceptions, brand leaders ensure their core offering remains both highly relevant on sensory/functional grounds and mathematically attractive in the store aisle.
Benchmarking Against Competitors in Cairo and Beyond
A brand’s health score in isolation provides limited strategic value. True market intelligence comes from benchmarking your performance against direct category rivals, emerging market disruptors, and shifting trade channels.
In Egypt’s fast-moving retail environment, competitive benchmarking requires looking beyond traditional multinational rivals. You must track your brand power against the rapid rise of hard discounters and private-label alternatives that are actively reshaping consumer habits.
The Power of BPI in Competitive Benchmarking
This is precisely where the Brand Power Index (BPI) becomes indispensable. By combining functional performance with emotional connection into a unified score, BPI allows brand managers to benchmark their equity directly against two distinct competitive threats:
- Legacy Rivals & Category Leaders: Evaluating whether your brand is closing the mental availability gap against established top-tier brands in top-of-mind recall and premium value perception.
- Hard Discounters & Private Labels: Measuring how effectively your brand equity defends against hard-discount chains like Kazyon, which operates over 1,100 stores across 23 Egyptian governorates, and private-label lines that undercut national brand pricing by 10% to 15% on essential staples.
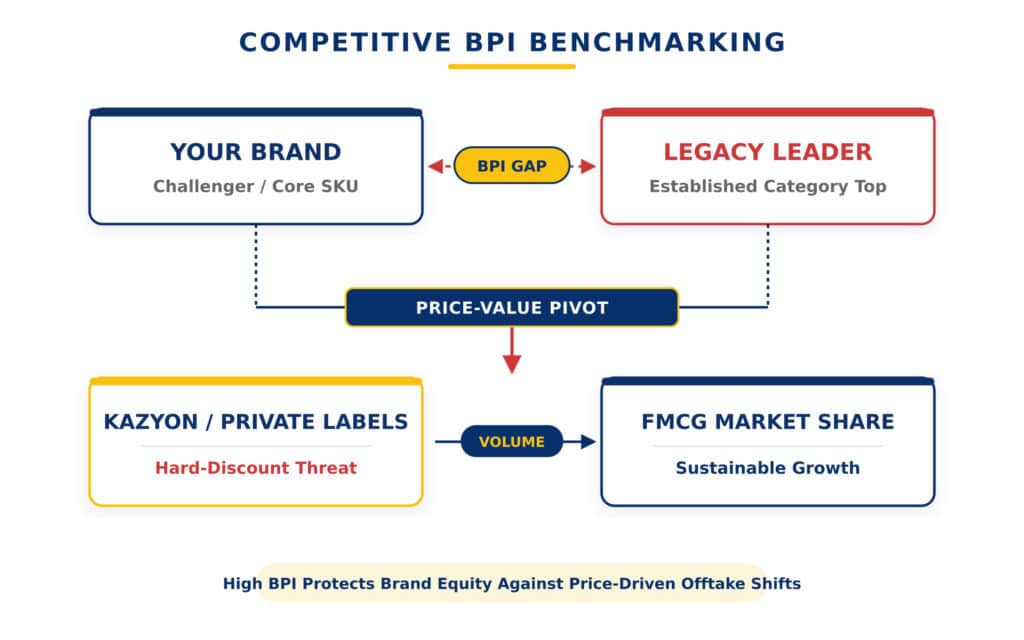
When a hard-discount chain expands its footprint, a high BPI acts as a protective shield. If your brand’s emotional equity and trust scores are strong, consumers will resist swapping your product for a store brand, even during tight budgetary periods. Conversely, a declining BPI signals that your product is becoming a commodity, making it vulnerable to lower-priced alternatives.
Segmenting the Data: Cairo vs. Regional Nuances
National averages often hide critical operational vulnerabilities. A brand might enjoy strong market health overall while quietly losing ground in key geographic regions or retail channels:
- Geographic Segmentation (Cairo/Giza vs. Delta & Upper Egypt): Consumer dynamics in urban Cairo or Alexandria, where modern hypermarket chains and fast-delivery e-commerce platforms hold significant share, differ vastly from Upper Egypt or rural Delta governorates, where traditional trade dominates. Benchmarking BPI regionally highlights where localized trade marketing or distribution push is required.
- Socio-Economic Class (SEC) Breakdown: Tracking equity dimensions across SEC tiers (Class A/B vs. Class C/D) reveals whether your price-value perception remains balanced across different income groups, guiding targeted packaging and promotional strategies.
- Traditional Trade vs. Modern Retail: Traditional trade remains the bedrock of Egyptian retail, dominating nationwide volume. Benchmarking your brand’s availability and top-of-mind awareness inside neighborhood bakkals versus modern hypermarkets like Carrefour ensures your brand equity converts into physical retail presence across all channels.
Cadence & Frequency: How Often Should You Track?
Determining the tracking frequency of a Brand Health Tracker (BHT) is an exercise in balancing agility with efficiency. Collecting market intelligence too infrequently leaves brands blind to competitive shifts, while over-tracking lower-velocity categories generates unnecessary noise and high research overhead.
The decision hinges entirely on category velocity, purchase frequency, and the seasonal volatility of the Egyptian consumer market.
Continuous (Rolling) Tracking: High-Velocity Categories
In high-velocity FMCG categories, such as Dairy, Packaged Snacks, Carbonated Soft Drinks (CSDs), and Juices, consumer choices occur daily or weekly. For these categories, market leaders employ Continuous (Rolling) Tracking, gathering consumer responses every single week and analyzing rolling 4-week, 8-week, or 12-week averages.
Continuous tracking is vital in Egypt because it smooths out extreme seasonal demand spikes:
- The Ramadan Consumption Surge: During Ramadan, food and beverage consumption patterns undergo a dramatic transformation. Studies show that food expenditure spikes significantly, with over 80% of Egyptian households changing their dietary and purchasing habits. Specific categories like yogurt, Laban, powdered drinks, dates, and juices experience massive, short-term demand surges. Continuous tracking allows brands to observe how promotional price-offs impact Top-of-Mind (TOM) awareness and trial conversion before, during, and immediately after the holy month.
- The Summer & Regional Migration Spike: Summer in Egypt represents a nationwide behavioral shift. As urban populations disperse toward coastal regions like Sahel (North Coast) and Alexandria while millions remain in city centers, beverage and snack spending surges, often accompanied by a 104% spike in online shopping and localized delivery usage. Continuous tracking helps brands isolate genuine equity growth from temporary seasonal volume surges.
Pulse (Quarterly/Biannual) Tracking: Lower-Velocity Categories
For lower-velocity categories, such as Home Care (laundry detergents, surface cleaners) and Personal Care (shampoos, skin care), purchase cycles are stretched across several weeks or months.
In these sectors, consumer brand perceptions move at a slower pace. Running continuous weekly tracking yields identical results week after week, leading to unnecessary spend. Instead, brand managers utilize Periodic Pulse Tracking (typically conducted quarterly or biannually):
- Measuring Campaign Impact: Pulse tracking is scheduled around major brand events, such as 30 to 60 days following a nationwide television campaign, a major product relaunch, or a price adjustment.
- Tracking Structural Shifts: Market reports highlight that while essential food and beverages recover quickly during economic shifts, personal care categories often lag as consumers streamline budgets and delay non-urgent purchases. Quarterly pulse tracking captures these structural shifts in brand consideration without over-investing in weekly field data.
The Local Reality: Why Brand Health Tracking in Egypt Hits Different
Executing brand tracking in a mature, predictable market is largely an exercise in software management. Doing it in Egypt is a dynamic, multi-layered operation. In a volatile market defined by currency realignments, shifting import dynamics, and evolving consumer allegiances, consumer perception moves rapidly.
To gain true commercial value from tracking data, FMCG leaders must navigate several localized factors that make Egyptian brand health unique.
The “Local Pivot” & Macroeconomic Sensitivity
Macroeconomic shifts in Egypt frequently trigger fast, structural pivots in consumer loyalty:
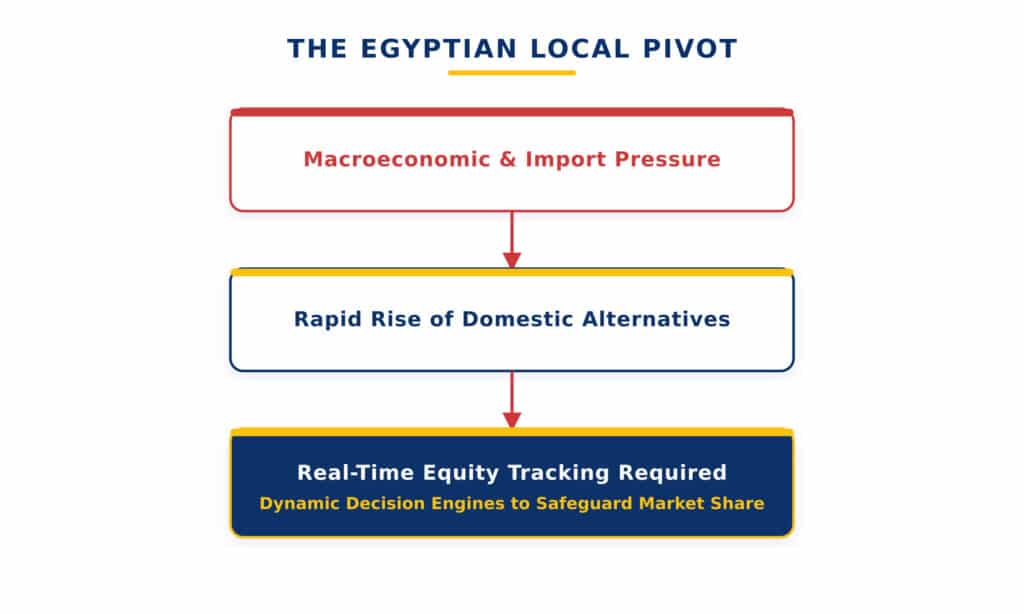
- Rising Support for Local Brands: Recent years have seen a major surge in consumer preference for local Egyptian alternatives across snacks, carbonated drinks, household care, and personal care. Domestic players have captured unprecedented market share in record time.
- The Velocity of Perception Drops: When import restrictions or boycott movements impact global brands, consumer sentiment turns within weeks, not months. A BHT built specifically for the local market captures these shifts early, allowing local brands to scale their physical distribution while enabling multinational players to adjust messaging and rebuild trust.
- Navigating Uncertainty: As outlined in Marketeers Research’s analysis on navigating VUCA environments in FMCG, volatile consumer environments demand continuous tracking to ensure pricing and trade promotions adapt before lost market share becomes permanent.
Bridging Traditional Trade vs. Modern Retail
In many Western markets, tracking brand health across major supermarket chains captures up to 80% of consumer behavior. In Egypt, the retail landscape operates on two distinct parallel tracks:
- The Neighborhood Bakkal Dominance: Traditional trade remains the backbone of the Egyptian retail economy, accounting for the vast majority of volume in daily essential categories. Brand health inside a traditional neighborhood kiosk—where mental availability, distributor relationship, and shelf space are highly competitive—behaves differently than in a hypermarket.
- Modern Trade & E-Commerce Expansion: Meanwhile, modern hypermarket chains and quick-commerce delivery platforms continue to gain ground in urban hubs. Consumers shopping on modern retail apps exhibit distinct price-elasticity patterns and brand switching behavior compared to traditional trade shoppers.
A localized BHT bridges this gap by ensuring sample panels represent both modern trade shoppers in urban centers and traditional trade consumers across governorates.
Overcoming Data Fragmentation with Actionable Analytics
Collecting field data across Egypt’s diverse trade channels is only half the battle; the real hurdle is turning scattered metrics into fast commercial choices. Many commercial teams find themselves overwhelmed by disparate spreadsheets and static dashboards that fail to drive real strategy.
- Connecting Perceptions to Commercial Execution: As highlighted in Marketeers Research’s guide to 2026 FMCG commercial trends, modern market research has evolved from static reporting into actionable diagnostic systems. Linking tracking metrics directly to pricing and promo scenarios allows brand teams to make confident, data-backed adjustments.
- Breaking Internal Silos: Brand managers cannot wait for end-of-quarter reviews to address a drop in consideration. As detailed in Marketeers Research’s study on overcoming insights friction, unifying brand health signals with trade-level performance allows marketing, revenue management, and sales teams to respond to market shifts in real time.
In Egypt’s fast-moving market, brand health tracking is not a passive reporting exercise. It is a live radar system built to turn market shifts into actionable growth opportunities.
Turning Data into Defensive Market Share
In Egypt’s high-velocity FMCG landscape, brand health tracking is far more than a passive performance review—it is an indispensable radar system for proactive market defense and growth. Waiting for end-of-quarter volume reports to diagnose market share erosion is no longer viable when consumer habits and trade dynamics shift within weeks.
By anchoring your tracking strategy in the Brand Power Index (BPI), commercial leadership gains a unified score that reflects both physical choice and psychological affinity relative to legacy rivals and hard-discount disruptors.
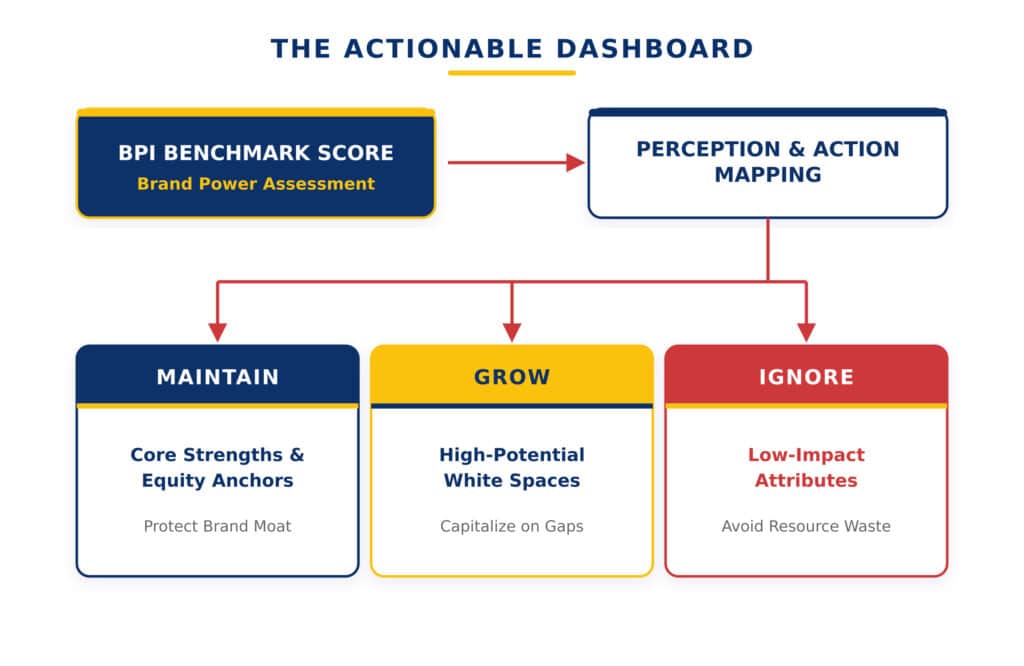
Crucially, translating BPI insights into real-world execution relies on the Maintain / Grow / Ignore perception framework:
- Maintain: Protect the core drivers—such as trusted taste profiles or key price-value associations—that safeguard your brand equity against low-cost alternatives.
- Grow: Capitalize on emerging white spaces, whether that means expanding localized sourcing credentials, launching high-demand pack sizes, or capturing shifting Category Entry Points.
- Ignore: Avoid wasting capital and trade budget on low-impact brand attributes that fail to move the needle on actual checkout conversion.
In a market as dynamic as Egypt, the difference between losing shelf space and commanding a category comes down to the speed and clarity of your consumer intelligence.
Take Control of Your Brand Equity
Partner with local research experts who understand the nuances of Egyptian consumer behavior, regional trade channels, and macroeconomic shifts.
Ready to transform your brand perception data into a commercial decision engine? Consult with the Marketeers Research Consumer Insights Team to build a customized Brand Health Tracker engineered for continuous growth.